Charts are a great tool because they communicate information visually. Design and share your own charts online at no cost.
Charts are often used to ease understanding of large quantities of data and the relationships between parts of the data. Charts can usually be read more quickly than the raw data that they are produced from. Wikipedia
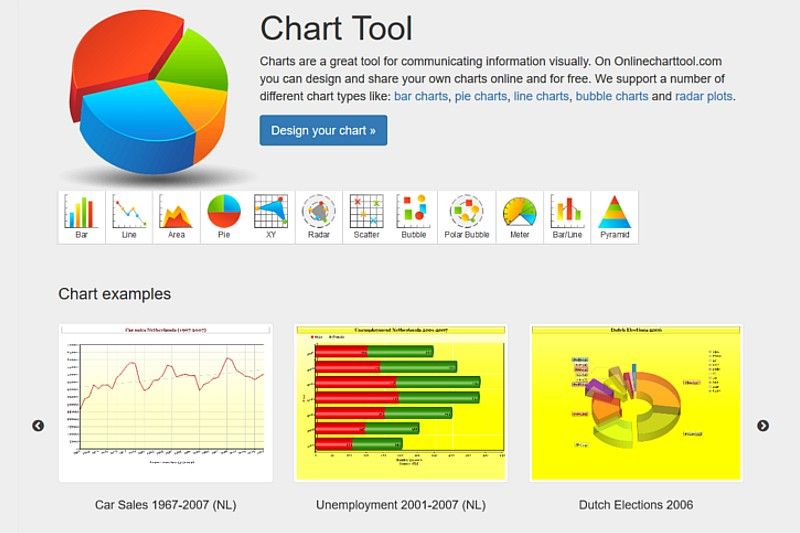
Online Chart Tool supports a number of different chart types like: bar charts, pie charts, line charts, bubble charts and radar plots.
5 easy steps:
- Design Chart. In this step you choose your Chart type. Choose for example a bar or line chart. If you made your choice you can personalize your chart with a number of differen settings.
- Add Data. In this step you add the data of your chart. First choose how many items and/or groups you want to show. If you want to create a bar chart about the sale of apples in the months january till december 2007, choose 1 group (apples) and 12 items (months of the year). If you want also a show the sale of bananas during the same year, choose 2 groups.
- Labels and Fonts. In this step you determine the settings for the datalabels and you can set your font type and font size.
- Preview grafiek. If you have entered all your data and youer settings you can click on 'preview chart' to show your chart and see if it is correct. You can always go back some steps to change your data and your settings.
- Save and Share In this step you can send your chart via email or save it as an image on your local computer. If you are registered and logged in on our site you can also save your charts online for further editing at a later stage.